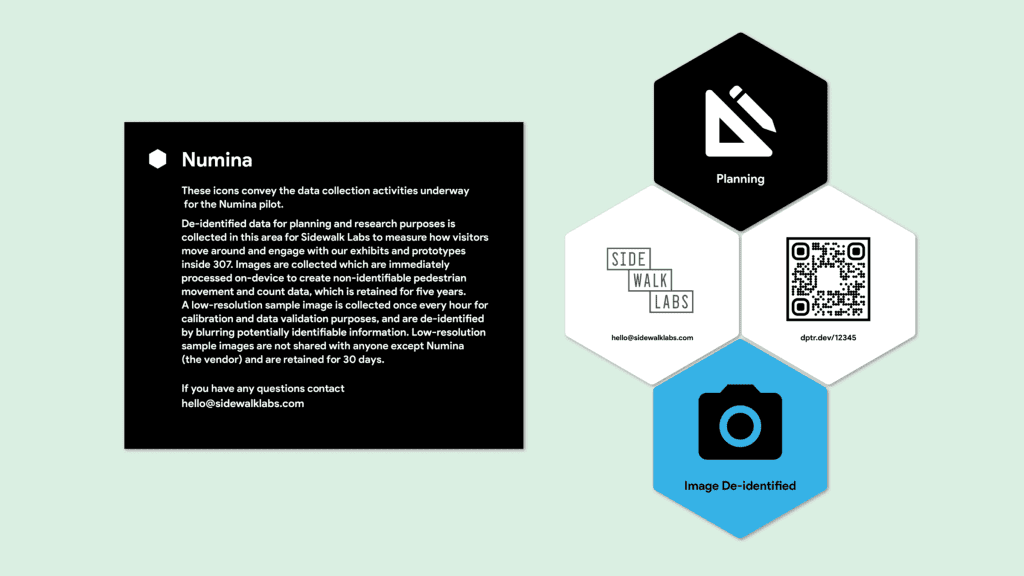
Sidewalk Labs has released a set of visual icons for smart cities to instruct citizens about the new technologies they are deploying. The point is to define and explain the role and accountability of digital solutions being rolled out public and private authorities in cities, and in the broader public realm.
The new icons, developed from workshops with “more than 100 participants from several cities” and released as initial prototypes, are designed to work like food nutrition labels for emerging digital systems in public spaces, making transparent their tech ingredients and privacy terms.
Sidewalk Labs, which is owned by Google parent Alphabet, has met with controversy in Toronto, where it is engaged in the $1 billion redevelopment of Toronto’s Quayside district as a green-field smart city district, over its proposed handling of data gathered about citizens and the urban environment from sensors it has placed around the waterfront.
The controversy has arisen partly because of Sidewalk Labs’ reluctance to confirm one way or another how data will be governed. Towards the end of last year, it proposed an independent ‘civic data trust’ should be established to take charge of urban data, but at the same time refused to guarantee citizens’ personal data would be protected.
Its new smart city graphics, released for public usage on open-source developer platform Github, seek to address the issue of privacy and transparency around data collected by new civic technologies.
“We strongly believe people should know how and why data is being collected and used in the public realm, and we also believe that design and technology can meaningfully facilitate this understanding,” the company said in a blog post, co-authored by principal designer Patrick Keenan and legal associate Chelsey Colbert.
The new design patterns – shaped as hexagons in order to easily tessellate information – provide four different categories of information: the purpose of the technology, the privacy of the data it collects, the entity responsible for it, and a QR code linking to additional information.

The privacy icons, also showing the type of application, are coloured yellow for ‘identifiable’ data and blue for ‘de-identified’ data. They would only be used when data is being collected, noted Sidewalk Labs. “When you are not identifiable, you don’t see this hexagon,” said the blog post.
Subscribe now to get the daily newsletter from RCR Wireless News
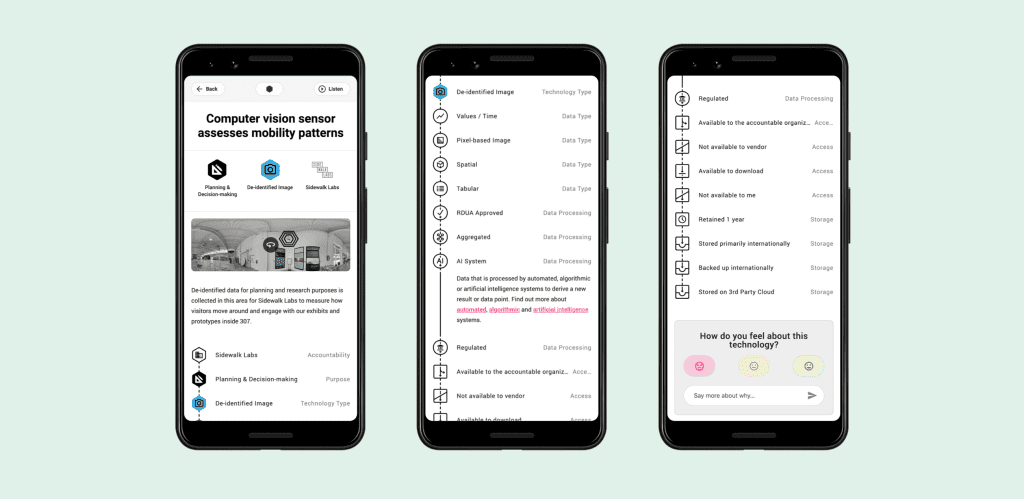
“Because the nuances of data custody and sensing technology can be complex and overwhelming to understand, we felt we needed to provide a consistent, linear way to organise and present information on this digital channel. So we designed a system of icons that chain together.”
The QR code on the physical infrastructure should link to information online about the software platform and data storage of each application. “People wanted to have an easy way to follow-up and learn more and know if the technology could “see” or identify them,” it said.
Where the purposes of the techology is articulated in hexagon shapes on the infrastructure and online, these other categories are represented by different shapes and appear online only.

“The chain contains three categories of information: the hardware and purpose of the technology, the software and data it uses, and the means of storage. Each category is represented by a different shape. The chain begins with icons conveying the responsible organisation, the purpose the technology serves, and the type of technology it is; this information is contained in hexagons,” said Sidewalk Labs.
“The following icons convey whether the data collected is identifiable, how it is processed, and who has access to the data; this information is contained in circles, representing the idea that the use and handling of data should be a continual activity. Finally, the last icons convey where the data is stored and who has access to it; this information is conveyed in squares (because we often store things in boxes.”
Sidewalk Labs explained: “There’s little transparency about what data these technologies are collecting, by whom, and for what purposes. Signage that does appear in the public realm often contains either small snippets, which give no indication of how to follow up or ask more questions, or multiple paragraphs of dense text. That’s a problem.”
“A movement toward digital transparency can help by providing easy-to-understand language that clearly explains data and privacy implications of digital technologies. Digital transparency can empower users to meaningfully engage in what is fast-becoming a critical conversation of our time.”

